Strategies to Turn Your Data into Insights and Revenue
The word data has become one of the buzz words in marketing and advertising. In the past, companies researched industry trends and used analysis by industry experts. Now, all departments play a role in collecting data about customer to help customize the online experience.
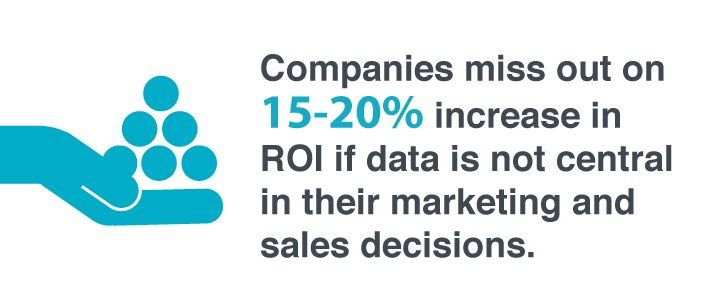
This is mainly done by being intentional in tracking your customer journey across team interactions and various newspaper platforms. To better track your user experience and journey, develop a set of rules to help mark the data points you need to capture. These data points will help establish common traits and values, which will create original and specific avenues to monetize your data. Learn to see your data as one of your main assets that will have a measurable impact on your bottom line.
Analysis Over Reporting
There are two ways to look at your data – numbers or insights. Many times just the numbers themselves do speak volumes about the success or failure of a project. But usually you really need to work with your data. This is where your insights come in. Use your data to answer what the numbers mean for your newspaper and what specific actions you need to take to change and improve the metrics you are measuring.
As you establish the context, there will be more buy-in from all departments to execute the action plan presented. Discuss and show how this will affect your business and the importance these actions will carry for each department. Consider using real examples from accounts that have benefited from slight changes in marketing projects and how your customer service has helped provide better service options that also drove increased customer spend.
Analysis will also include evaluating visitor expectations. When you review what content was most viewed and how that content was accessed, the visitor’s decision to click your link can be evaluated. Even your bounce rates inform your team that the topic is of interest but the content did not meet the expectations of your audience. This is an opportunity for your team to generate a new direction or revise some of your main points.
Data Insights Form an Action Plan
Data insights come from the right analysis, and the right analysis comes from your measurement criteria. Your measurement criteria is driven from your main business questions and objectives. Your data might challenge or change your business objectives as you discover certain user behaviour that might not match up with your business questions.
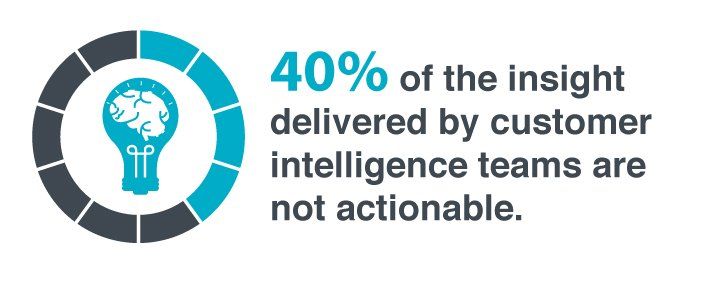
Make sure you have segmented your data correctly. As you group user behaviour data that share the same criteria in common, this will help narrow down the information and make it easier to dig deeper. But if your initial assumptions are wrong, do not hesitate to go back to the beginning. Remember that interesting findings do not always translate into actions.
Your action plan needs to include specific problems that you are solving. Maybe more than one major problem will pop-up from the data about your content and site. The important step is to prioritize them and focus on the top of the list. Take your time to quantify your actions with number and deadlines. If there is no way to keep your team accountable, the plan will not accomplish its purpose. Do not miss to make your plan easy to monitor and help your newspaper to achieve a higher level of performance.
Use Data Visualization to Back Actions
After the initial stage of executing your plan, you need to account for all the effort taken to complete these actions. Your data story needs to convey the positive improvements that have been accomplished. Do not forget to include how and why, with focus on what actions will still be used moving forward.
The best way to illustrate how valuable your actions have been, is to use visualization. Sometimes data can be harder to describe because it is just numbers on a page. For example using progress charts can help show the actual change that has taken place from simple percentages to actual relationships and patterns between your measurement criteria. Not only that, you can use visualization to identify emerging trends for your brand.
meaning to the data by using correlated visuals to help your team discover the solution all together. The main focus is to extract the potential value of the data that will translate into revenue growth. Relevant and profitable patterns can remain hidden in between the numbers and columns of your analytics.
Simply collecting the data is not why analytics is so popular. Data helps to provide an overview of why something is not working and ways this can be improved. Your initial data will help you gain insights and put together a strategy for where your newspaper is heading. Activate your data to optimize the information to drive true business value and turn it into revenue.